

Rigid packaging solutions manufacturer Silgan Holdings (NYSE:SLGN) fell short of the market’s revenue expectations in Q1 CY2025, but sales rose 11.4% year on year to $1.47 billion. Its non-GAAP profit of $0.82 per share was 4% above analysts’ consensus estimates.
Is now the time to buy Silgan Holdings? Find out by accessing our full research report, it’s free.
Silgan Holdings (SLGN) Q1 CY2025 Highlights:
- Revenue: $1.47 billion vs analyst estimates of $1.48 billion (11.4% year-on-year growth, 0.7% miss)
- Adjusted EPS: $0.82 vs analyst estimates of $0.79 (4% beat)
- Adjusted EBITDA: $209.9 million vs analyst estimates of $224.6 million (14.3% margin, 6.5% miss)
- Management reiterated its full-year Adjusted EPS guidance of $4.10 at the midpoint
- Operating Margin: 8.9%, in line with the same quarter last year
- Free Cash Flow was -$766.3 million compared to -$668.3 million in the same quarter last year
- Market Capitalization: $5.61 billion
"Our team delivered another quarter of record results with adjusted EPS growth of 19% that was near the high end of our expectation in the first quarter, as volume growth and outstanding operating performance across all segments, strong results from the Weener acquisition and continued execution of our cost reduction program drove our success. Once again, the strength of our teams, the power of our diverse portfolio and the success of our unique value creation strategy continue to set Silgan apart in the market," said Adam Greenlee, President and CEO.
Company Overview
Established in 1987, Silgan Holdings (NYSE:SLGN) is a supplier of rigid packaging for consumer goods products, specializing in metal containers, closures, and plastic packaging.
Sales Growth
A company’s long-term performance is an indicator of its overall quality. Any business can put up a good quarter or two, but the best consistently grow over the long haul. Over the last five years, Silgan Holdings grew its sales at a tepid 6% compounded annual growth rate. This fell short of our benchmark for the industrials sector and is a rough starting point for our analysis.
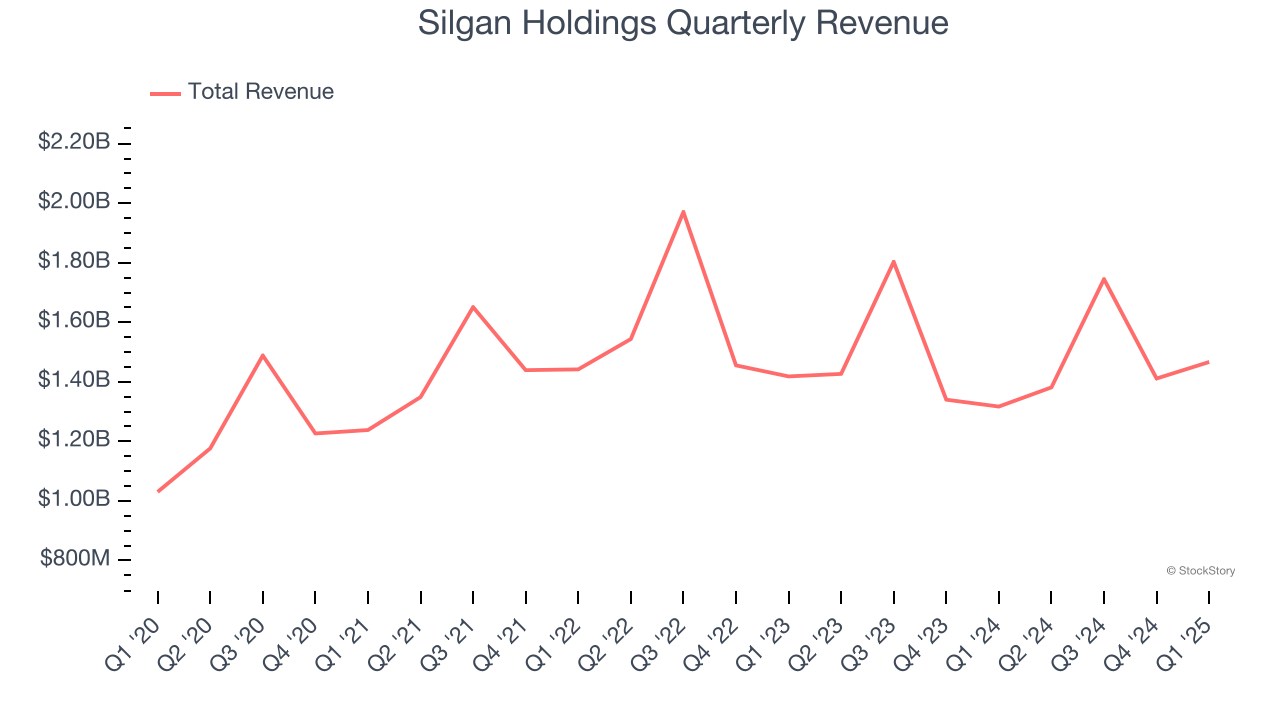
Long-term growth is the most important, but within industrials, a half-decade historical view may miss new industry trends or demand cycles. Silgan Holdings’s performance shows it grew in the past but relinquished its gains over the last two years, as its revenue fell by 3% annually. Silgan Holdings isn’t alone in its struggles as the Industrial Packaging industry experienced a cyclical downturn, with many similar businesses observing lower sales at this time. 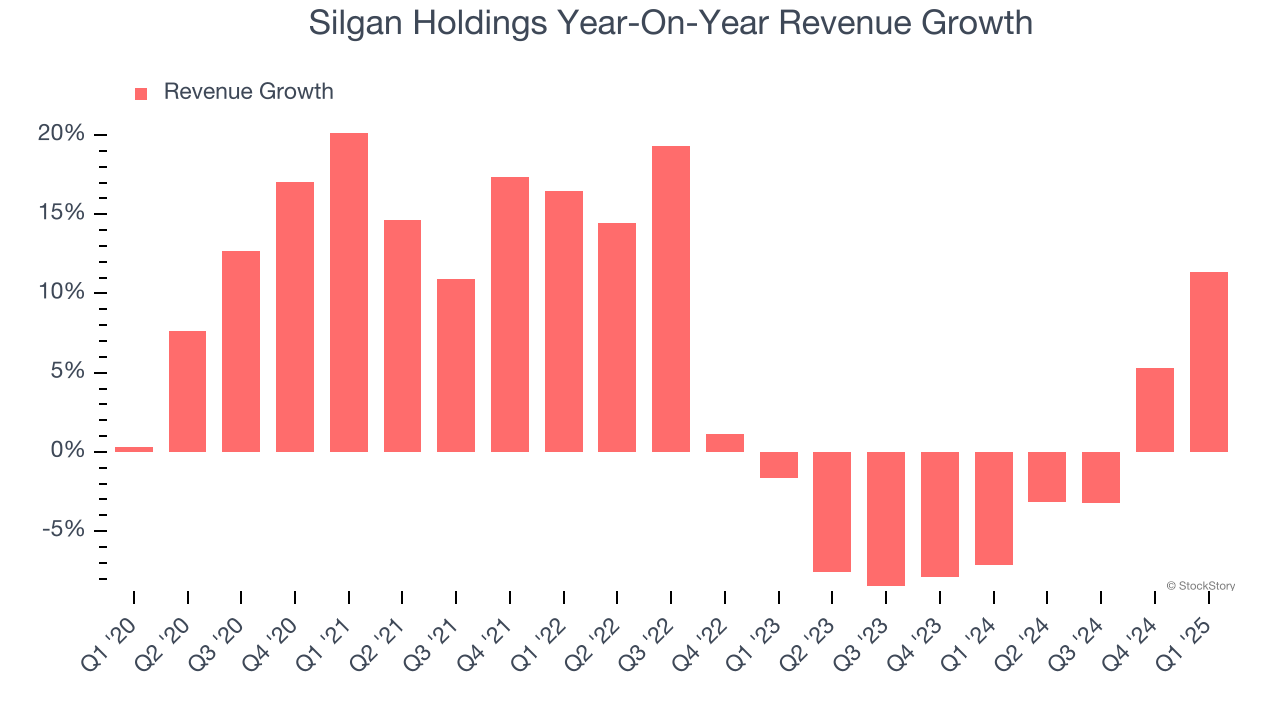
This quarter, Silgan Holdings’s revenue grew by 11.4% year on year to $1.47 billion but fell short of Wall Street’s estimates.
Looking ahead, sell-side analysts expect revenue to grow 7.9% over the next 12 months, an improvement versus the last two years. This projection is above average for the sector and suggests its newer products and services will fuel better top-line performance.
Here at StockStory, we certainly understand the potential of thematic investing. Diverse winners from Microsoft (MSFT) to Alphabet (GOOG), Coca-Cola (KO) to Monster Beverage (MNST) could all have been identified as promising growth stories with a megatrend driving the growth. So, in that spirit, we’ve identified a relatively under-the-radar profitable growth stock benefiting from the rise of AI, available to you FREE via this link.
Operating Margin
Silgan Holdings has done a decent job managing its cost base over the last five years. The company has produced an average operating margin of 9.7%, higher than the broader industrials sector.
Looking at the trend in its profitability, Silgan Holdings’s operating margin decreased by 1.6 percentage points over the last five years. Many Industrial Packaging companies also saw their margins fall (along with revenue, as mentioned above) because the cycle turned in the wrong direction. We hope Silgan Holdings can emerge from this a stronger company, as the silver lining of a downturn is that market share can be won and efficiencies found.
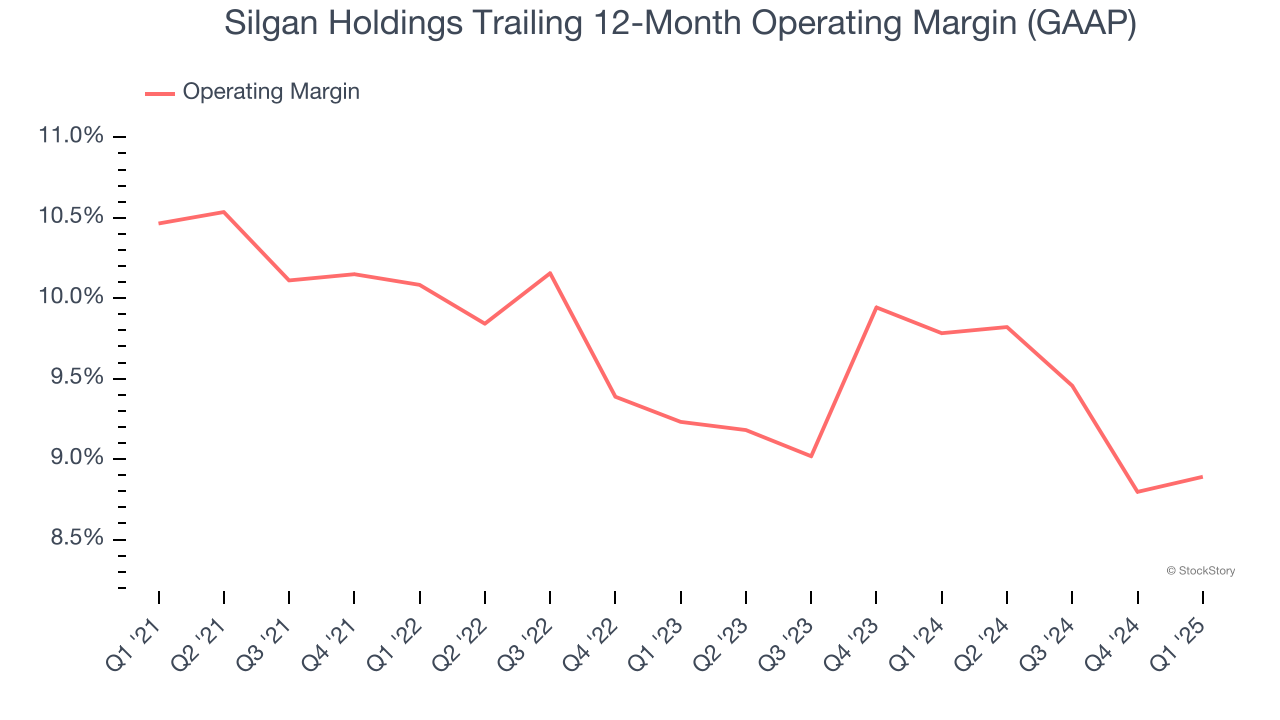
This quarter, Silgan Holdings generated an operating profit margin of 8.9%, in line with the same quarter last year. This indicates the company’s cost structure has recently been stable.
Earnings Per Share
We track the long-term change in earnings per share (EPS) for the same reason as long-term revenue growth. Compared to revenue, however, EPS highlights whether a company’s growth is profitable.
Silgan Holdings’s EPS grew at a solid 10.7% compounded annual growth rate over the last five years, higher than its 6% annualized revenue growth. However, this alone doesn’t tell us much about its business quality because its operating margin didn’t expand.
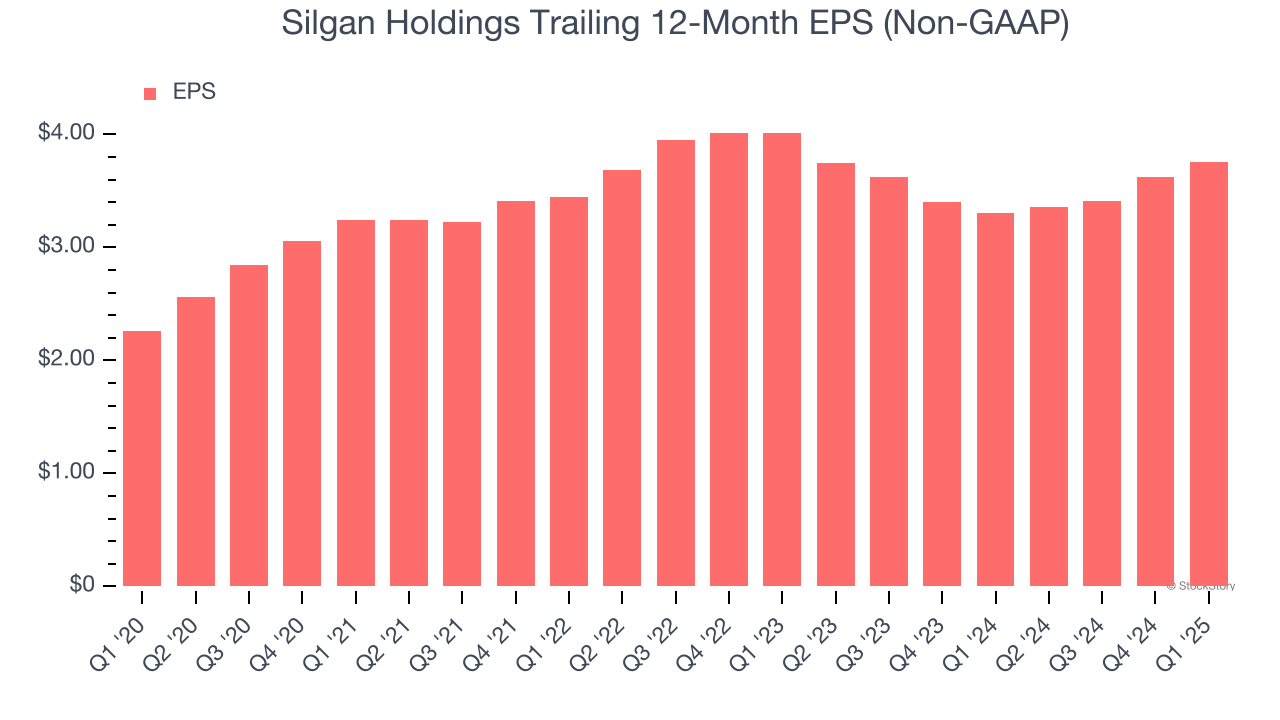
We can take a deeper look into Silgan Holdings’s earnings to better understand the drivers of its performance. A five-year view shows that Silgan Holdings has repurchased its stock, shrinking its share count by 3.7%. This tells us its EPS outperformed its revenue not because of increased operational efficiency but financial engineering, as buybacks boost per share earnings. 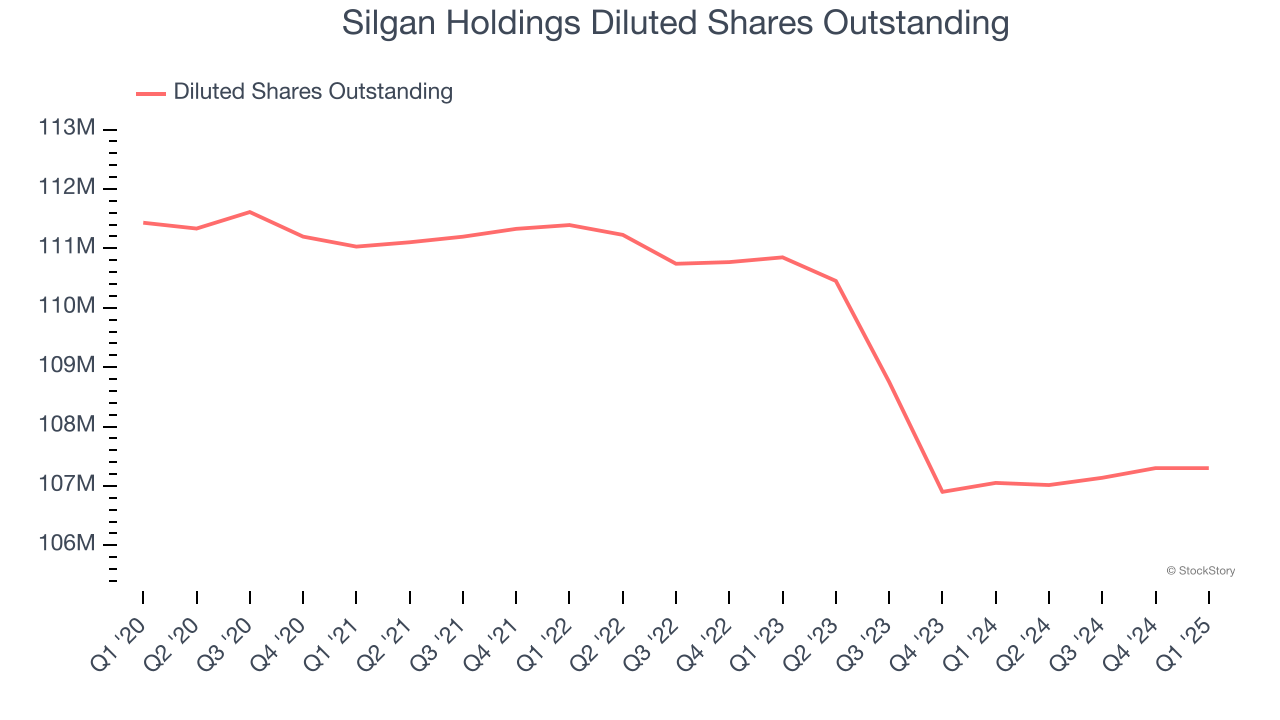
Like with revenue, we analyze EPS over a more recent period because it can provide insight into an emerging theme or development for the business.
For Silgan Holdings, its two-year annual EPS declines of 3.2% mark a reversal from its (seemingly) healthy five-year trend. We hope Silgan Holdings can return to earnings growth in the future.
In Q1, Silgan Holdings reported EPS at $0.82, up from $0.69 in the same quarter last year. This print beat analysts’ estimates by 4%. Over the next 12 months, Wall Street expects Silgan Holdings’s full-year EPS of $3.76 to grow 10.8%.
Key Takeaways from Silgan Holdings’s Q1 Results
It was encouraging to see Silgan Holdings beat analysts’ EPS expectations this quarter. We were also glad its full-year EPS guidance was in line with Wall Street’s estimates. On the other hand, its EBITDA missed significantly and its revenue fell slightly short of Wall Street’s estimates. Overall, this was a weaker quarter. The stock traded down 1.8% to $51.50 immediately after reporting.
Silgan Holdings didn’t show it’s best hand this quarter, but does that create an opportunity to buy the stock right now? What happened in the latest quarter matters, but not as much as longer-term business quality and valuation, when deciding whether to invest in this stock. We cover that in our actionable full research report which you can read here, it’s free.